Skip to Main Content

User research methods: how to gain unfiltered insights and attitudes

User research methods can give your organization insight into what users need most. If your business doesn’t have a department devoted to user research (most don’t) you may not know what your ideal users are looking for in a specific product or service. This gap in what they want and what exists is where opportunity lives. User research gives you a map for how to get there.

As laid out in our discussion of design thinking, user research is the point in the process where you survey the users about their own experiences by acquiring divergent data about their actions and thoughts. The broad range will give you many ideas you probably aren’t thinking of or solutions you never thought to solve for. The user is king and you must use their insights as a beacon during the process.

By the end of this piece, you’ll have an understanding of what user research tools and data look like so you can start to plan what your own team’s process will be.

The goal of user research strategy is to make something great

The user research process is not an opportunity to prove a theory—it’s a way to develop a deeper understanding that will produce a theory. As we discussed in this piece, kicking off a project with user research ensures you are building something valuable to your users. Building something no one wants or uses is a waste of your company’s resources. While it costs money to engage in user research, it costs much more money to build something people don’t want to use.

User research methods: how to get the best insights

The axis on the image above shows the range of variables that go into user research and the tools that can get you those data points. Different tests can get you different data points, all of which can be useful depending on what your goals for research are.
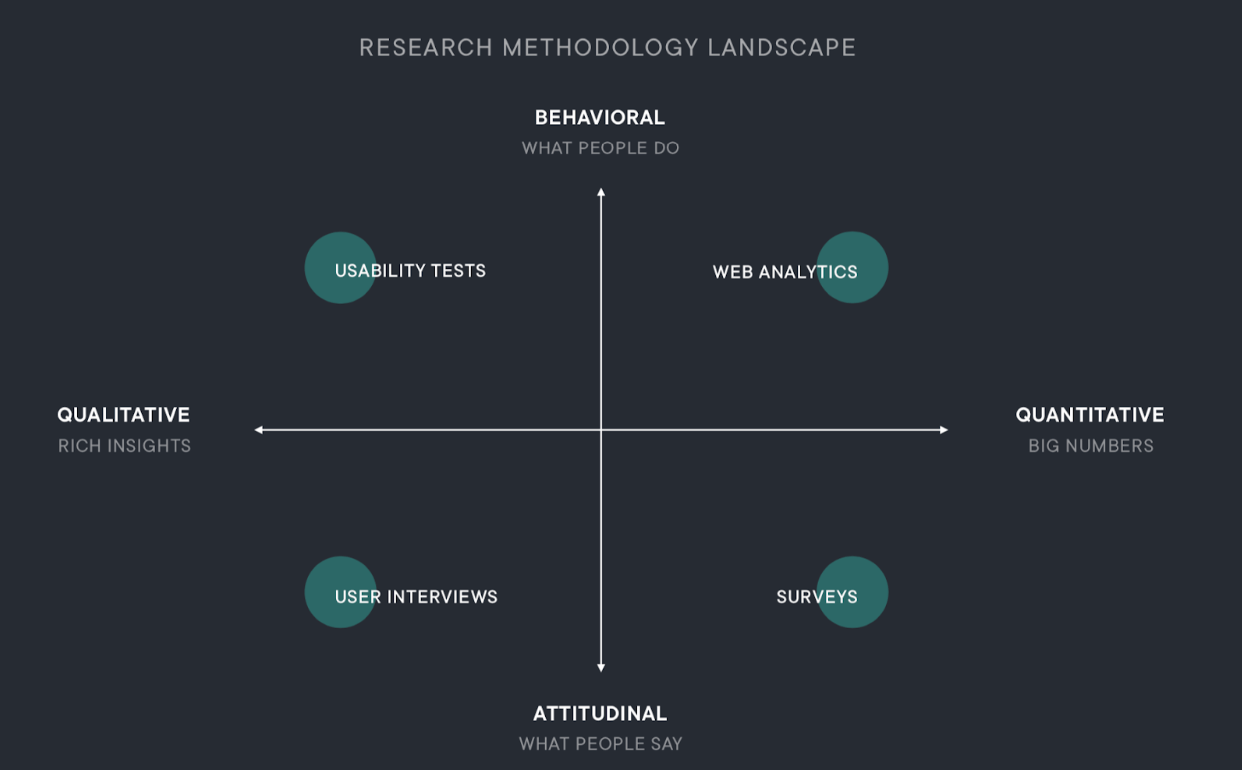
Research Methodology Landscape


We’re going to break down the image above across the axis of research methods and the data they produce from Behavioral data (a users actions) to Attitudinal data (a users feelings about their actions) and Qualitative data (rich, nuanced reasoning) to Quantitative data (big, general statistics and actions).

Behavioral data: what people do

Some of the easiest data to accrue from users is behavioral. Tracking what they do in the landscape of analytics and data tracking is one of the biggest industry booms in the digital landscape. Almost all users of an app or visitors to a website automatically opt into having their activity tracked by the administrators of that site. From that data, a company can see what people do en masse and draw conclusions about how to make them do more of the things they want and less of the things they don’t.

This kind of data found in things like usability tests or website analytics are good for improving something you’ve already built.
Find a new product in 5 days? Learn how with our free Google Design Sprint ebook.

Download ebook

Attitudinal data: what people say

One of the things absent from the behavioral data is the reasons behind their actions. As you can see in the landscape image, both tests that give you attitudinal data — user interviews and surveys — speak directly to users. This gives them the space to give you information that no click on a website can substantiate. How does this problem make you feel.

By understanding the motivation behind actions we can get closer to building a product that genuinely changes a user’s life for the better. Who could ask for more than that?

Qualitative data: how people feel

Qualitative data gives you both the reasons behind actions users take and the observations of those actions in progress. Pairing the physical insights from something like a usability test with the attitudinal data from a user interview can give you the full picture of the mind/body experience of a user. Deep insights like, movements, language, posture, ease of use and an innumerable amount of actions/feelings are at your disposal when acquiring qualitative data.

In the early stages of product design, qualitative can give you the most beneficial data because you are often seeking to build something completely new.

Quantitative data: tracking people’s actions

Quantitative data is the type of information you gather without interacting directly with the user. Things like website analytics show what behavior your users conduct when they visit your site.

Quantitative data can be most beneficial when you are looking to improve an already existing product or experience. For instance if you are surveying the UX of a website and in the analytics of your user journey they often leave your site after visiting one specific page, the quantitative data is showing you that the user is missing value in that webpage. Time to improve that specific page.

Design thinking depends on good user research strategy

When conducting a product design sprint, we like to start with user interviews. Speaking directly to the users you want to solve a problem for will give you a wide array of options for how to alleviate pain points. Throughout the design process your team will discuss many different ideas in a collaborative way. The guide post you will work from will start with the insights and user attitudes you finish this project with. If you don’t get this stage right, everything you build after it will be invalid.

Why user interviews are necessary to other data sets

User interviews can also inform the other data you collect. Broad data like website analytics can be explained by the feelings and attitudes expressed by your users in interview settings. Surveys and usability tests can also have a few grey areas filled in by the understanding you get from a user interview. Motivations are the highest level thinking you can get from a user and without them you can have user actions without knowing why those actions exist.

User interviews: getting insights and attitudes

Let’s take a step-by-step look into our motivations when we conduct a user interview:

  • What is our goal?
    • We want to gain a broad understanding of our users’ current experience and their goals, motivations, and pain points. We want to know why they do something and what gets in their way.
  • Where do we start?
    • Decide who your primary user group is, and begin recruiting for 45−60 minute interviews. These can be in person or remote via video call.
  • How do we interview them?
    • We’ll write an interview script based on what we want to learn more about, keeping in mind, the more open-ended, the better.
    • We’ll conduct interviews with user while a colleague takes notes.

You can see more about how to write a script for a user interview here.

Data from user research methods are just the beginning

The user research methods outlined here are just the beginning of the product design process. By the end of the process you should have loads of valuable user insight laid out across a whiteboard, showing you the big picture of what you are going to try and solve for in this design sprint. If this process seems like the thing your company needs to develop your next big product — like we did with Tyson Foods and Brinklet’s start a conversation.

Published by Product Design in Design Thinking|User Research

Let’s start a conversation

Let's shape your insights into experience-led data products together.