This is not an article about the challenges we commonly share around data. It is siloed. Its use is highly restricted. It takes time and effort to find and use. This article looks forward to what’s next. As we overcome foundational data challenges, we can step out of the bits and bytes of data. We can start to rethink how we manage and use knowledge itself.
The creation and sharing of knowledge is what allows science to advance. It is the intellectual property generated by research & development. And it is different from raw data. Knowledge sits on top of data, adding meaning and building on context and experience (see Figure 1).
Biopharmas possess vast amounts of knowledge. But it is rarely in a form that can be easily and systematically used by researchers. It lies buried within oceans of data, in literature articles, in the minds of individual experts, and in PowerPoint presentations. It cannot be rapidly searched by a researcher or used by an algorithm because it hasn’t been extracted and captured.
Now instead let’s imagine a world in which all of your organization’s knowledge is captured and accessible in a form digestible by both humans and machines. Each researcher now possesses the full knowledge of the organization at the moment they need it. And automated reasoning and analytics can build upon it to discover new insights and knowledge.
Below I’ll introduce this new approach to managing knowledge that we’re seeing in drug discovery and development. This is not sharepoint or wikis. It is knowledge extracted from data, literature, and experts, and made readily accessible for researchers to explore, learn from, and run quantitative analyses on. It is the future of data and knowledge in biopharma.
Knowledge ≠ data
We intuitively understand that knowledge and data are not the same thing. Data is a collection of individual facts––raw, unconnected, and without context. Knowledge has more weight. It is a sum of experiences, more concept than fact, incorporating context and meaning.
Between data and knowledge lies information. It is data that has been connected and organized, and which forms the building blocks of knowledge.
This is often visualized as a hierarchy with each level building on the one beneath, eventually leading to the actionable insights.
A common form of this is the DIKW pyramid which refers to Wisdom instead of Insight.
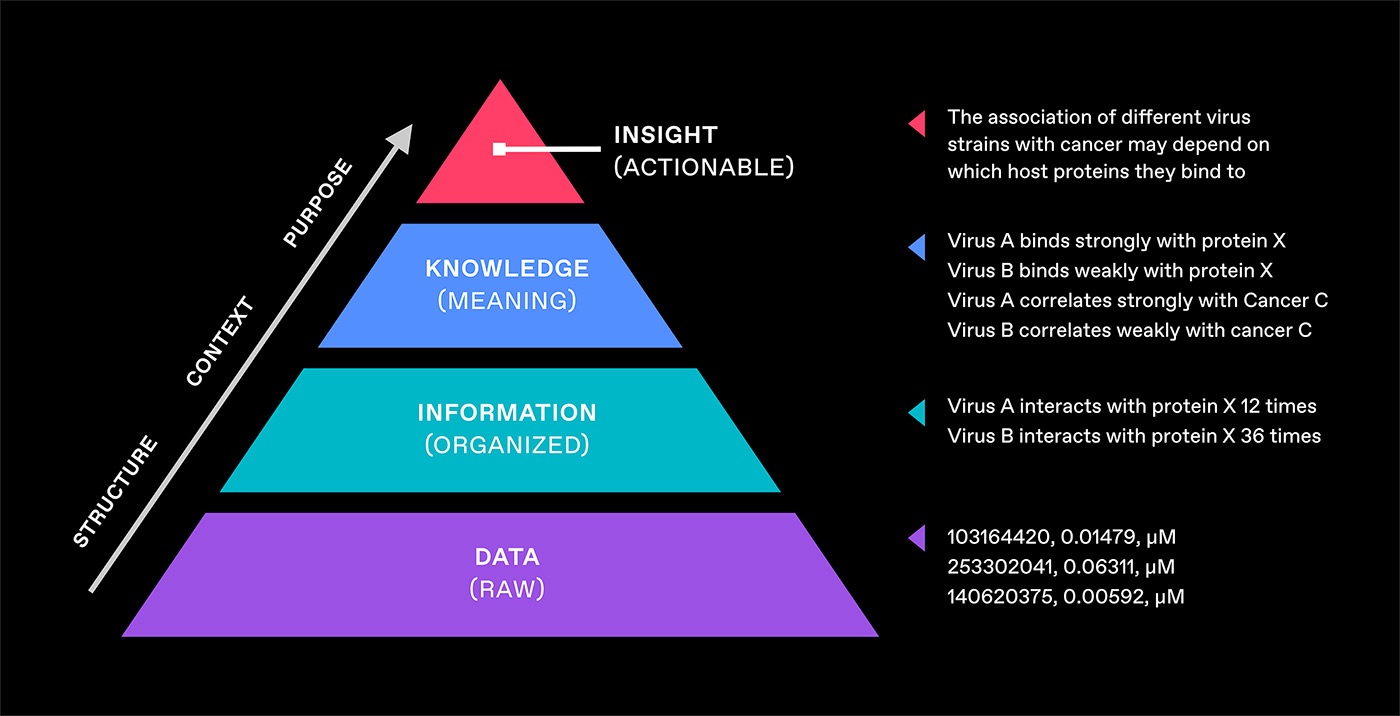
In the example of the pyramid in Figure 1:
Data is raw bioassay results.
Information aggregates and organizes those results, turning them into something more understandable and useful.
Knowledge applies methods for contextualizing and interpreting the information (e.g., how to define strong binding vs. weak binding).
Insights can now be drawn from the knowledge (e.g., the hypothesis that the association of virus strains with cancer may depend on which host proteins they bind to).
Most organizations are investing in structuring and organizing their data into information. Few have started on the next step of extracting and modeling the knowledge within that information.
But that’s essential for biopharma companies that want to pursue truly innovative work.
Why knowledge in addition to data?
Research typically starts with high-level exploratory and directional questions: What might be the cause? What safety issues might occur? Researchers follow an iterative process of developing and testing hypotheses and pruning unsuccessful paths. But this method is slow. Reading articles and testing in a wet lab takes weeks and typically answers just one question at a time.
If we want to accelerate research, we have to find a way to accelerate the process of answering these questions.
That’s a significant challenge, in part because of the scale of data involved. Answering questions using data is tedious and time intensive. This is due to the effort required for sourcing and preparing data, but also because of its volume and detail.
It is difficult to see the forest for the trees when looking at raw data. But moving from data to knowledge reveals the forest.
Knowledge (such as virus A binds strongly with protein X) can provide answers to directional questions. When we can extract this knowledge from the data, we’ve solved the problems of scale and preparation. Instead of sifting through data, researchers can focus on using knowledge, answering questions rapidly, and thus fast-forwarding research. Researchers still need to go into the underlying data and wet lab eventually, but less frequently and with higher confidence that the work they’re doing is on a path that leads to success.
A useful example is drug repurposing. A researcher wants to evaluate the potential of existing drugs on a particular disease. The researcher will ask questions like Which genes are most closely associated with the disease? and Which drugs have the greatest effect on those genes? Given an easy way to search and connect knowledge statements, the researcher can quickly narrow in on the best repurposing opportunities to further investigate.
Example of knowledge statements:
COVID-19 has a strong association with gene EXOSC8
Gene EXOSC8 has a medium association with gene IL1B
Clomipramine has a medium effect on gene IL1B
* Knowledge statements extracted from raw data, courtesy of tellic.
Knowledge graphs
So what does representing and managing knowledge look like in practice? The results page on Google, for one (see Figure 2).
If you ask Google who was married to Queen Elizabeth?, it answers the question and provides an infobox summarizing its knowledge of Prince Phillip. These results are powered by a knowledge graph with 500 billion facts on five billion entities. To answer your question, Google finds the entity representing Queen Elizabeth in the graph and then looks for connected entities of type person with a relationship of type married (see Figure 3).

In this example graph, the icons represent different entity types and relationships are labeled with their types.
A knowledge graph consists of a collection of real-world entities (e.g., diseases, genes, and drugs) and the relationships among them. It exists in a human- and machine-understandable format, with semantics. In other words, “COVID-19” isn’t just a string but represents the disease itself.
The knowledge statements from the COVID example above might look like what's in Figure 4:

In this graph, the thickness of the line represents the strength of the relationship. And if you drill into the entities or relationships, each can have additional attributes:
Drug: aliases, weight, mechanism of action, etc.
Drug-gene relationship: strength, modality, source, species, etc.
Using knowledge graphs
Knowledge graphs are explicitly intended for use both directly by humans (via direct exploration) and in machine learning and automated reasoning.
To answer questions, discover knowledge, and develop new hypotheses for further investigation, researchers engage with knowledge graphs through direct exploration. Direct exploration usually happens via three kinds of interfaces:
Graph interfaces allow researchers to interactively explore and build out a visual representation of the graph as they ask and answer questions (see Figure 5).
Dashboard interfaces provide researchers with charts and read-only visualizations of the graph. This is similar to a traditional dashboard but built on top of the knowledge graph rather than a relational database.
Query languages like cypher enable programmatic interaction with graphs as SQL does with relational databases.

Machine learning and automated reasoning with knowledge graphs may have even more potential than direct exploration. Network-based approaches can not only answer questions about existing knowledge and help researchers generate new hypotheses but also infer and generate new knowledge. They have already demonstrated promise, such as in target discovery, side effect prediction, and drug repurposing.
Some of the approaches include the following:
Shortest path (or strongest path) algorithms can identify connections between entities (say, a compound and disease) with the highest potential for investigation.
Link prediction algorithms measure the closeness of a pair of entities. Gaps in knowledge often appear as missing relationships in a knowledge graph. Link prediction can infer missing relationships, thus generating new knowledge.
Centrality algorithms help better understand the roles played by different entities by evaluating their importance. For example, the Page Rank algorithm is how Google ranks websites in search results. This helps researchers identify key entities, group dynamics, and bridges between groups.
Community detection algorithms identify sets of entities that have more relationships within the community than outside the community. Researchers can then focus in-depth analysis within communities.
Node similarity algorithms measure similarity between entities, again fast-forwarding researchers by highlighting avenues that warrant further investigation.
Knowledge, not data, advances drug discovery
In this piece, I aimed to paint a picture of how we can organize data to derive knowledge. This is just one part of knowledge management, however. I didn’t touch on how to extract, capture, or model knowledge. The biggest takeaway I hope you’ll have, though, is that biopharmaceutical companies that invest in their data in this way will empower their researchers to significantly speed up drug discovery.
For more inspiration on the benefits of harnessing data to gain new knowledge, look to recent successes in financial fraud detection, journalist investigations such as the Panama Papers, understanding skill sets at NASA, and many other domains.
If you’d like to hear more about what the process of creating knowledge looks like, please get in touch.