Skip to Main Content

Using data to accelerate development of new pharmaceuticals

The brief

Driving digital & data innovation in biopharma R&D

Developing novel medicines to tackle challenging health conditions is an extremely costly and inefficient process. For the last three decades, the timeline and cost of developing new drugs has been stagnant. In other words, the pharma industry has a productivity problem.

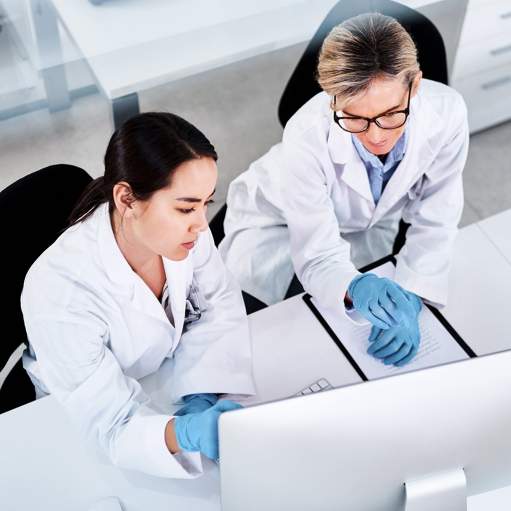
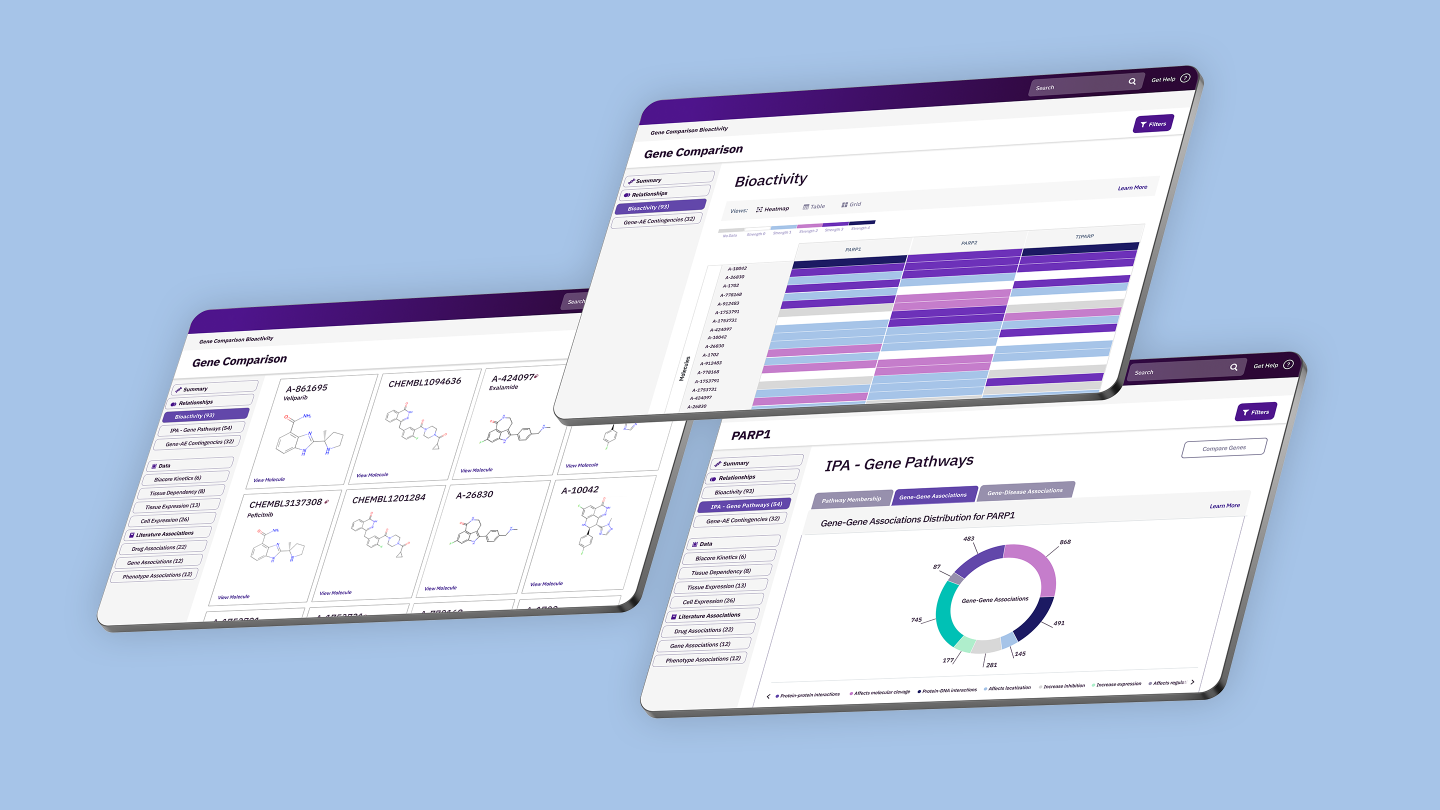
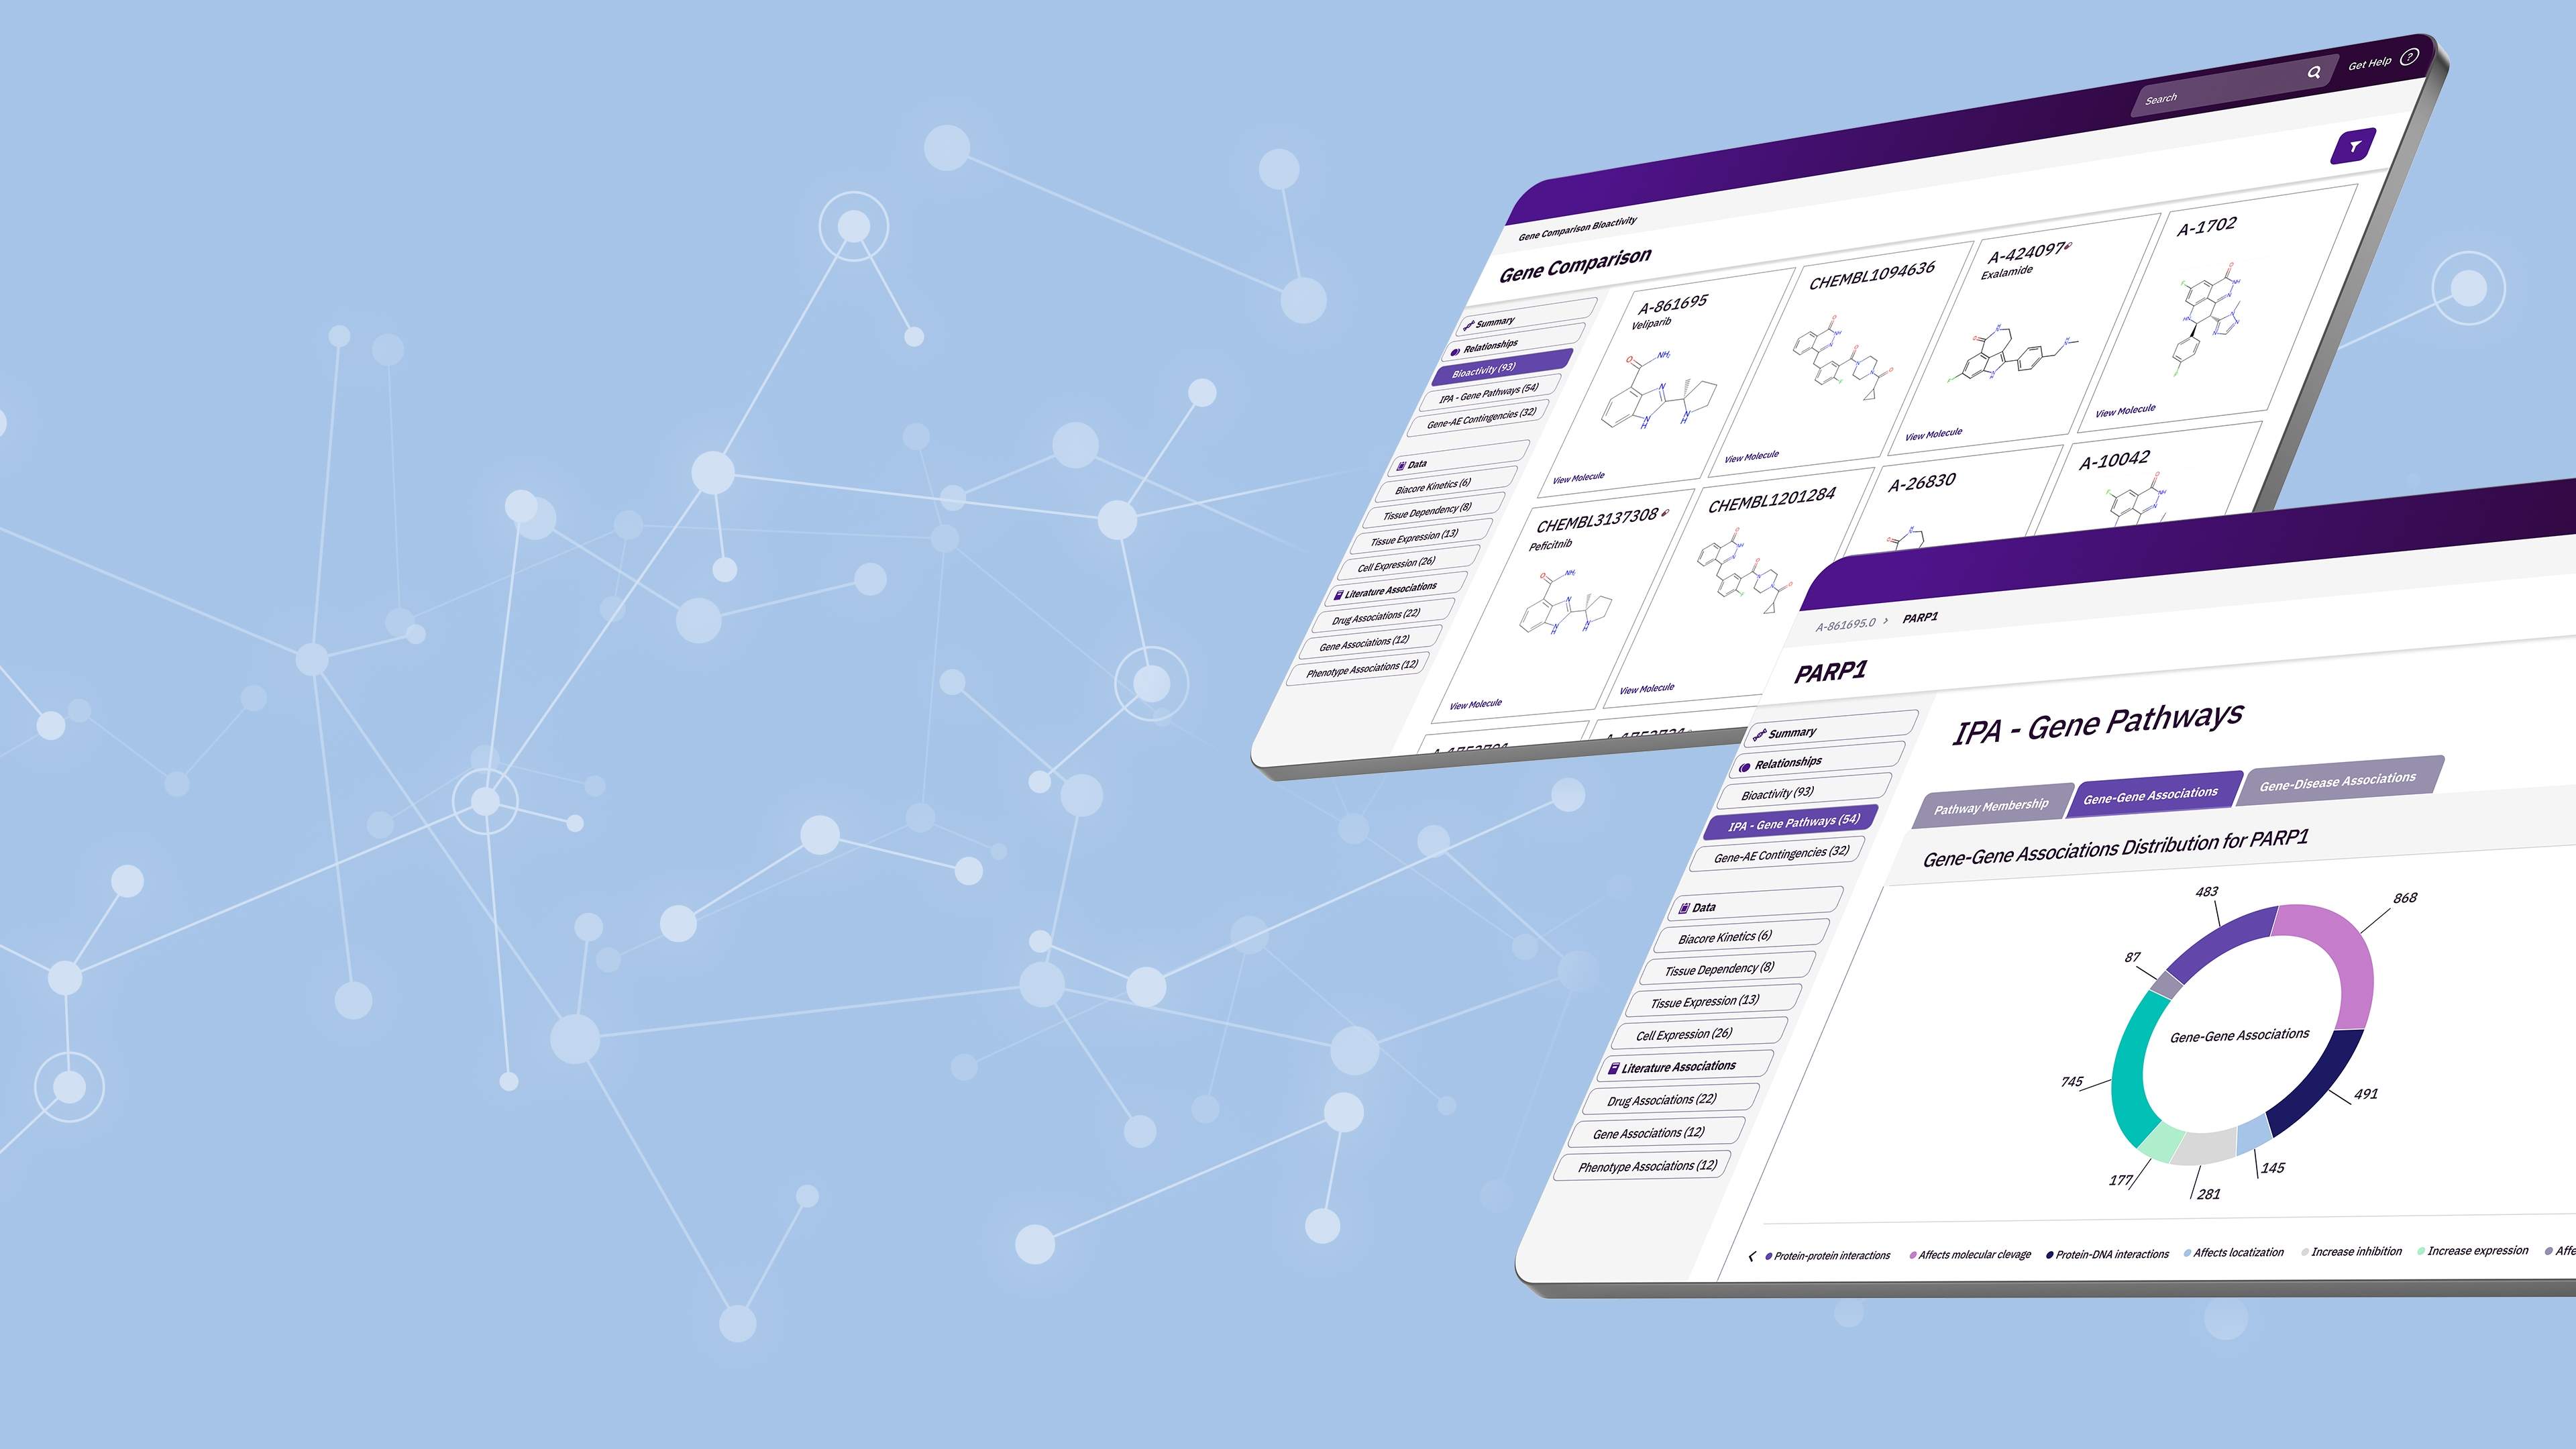
In 2019, TXI was approached by a Fortune 100 biopharma company with a huge vision: Double R&D productivity over five years by tapping existing data to create a centralized knowledge platform for their 14,000+ scientists to do hypothesis generation and exploration.

The big question: How do we tackle such an ambitious goal?

What we are building together is empowering scientists to answer scientific questions in minutes instead of weeks. We’re driving insights at scale to accelerate R&D productivity through democratizing and digitizing data and knowledge.

VP, R&D at Fortune 100 BioPharma

The challenge

Disrupting data silos & defining new ways of working

Before jumping in, we ran a 6-week Discovery to understand how scientists are doing this today and where the biggest opportunities for data-driven innovation and transformation existed within the R&D organization. We interviewed over 50 key R&D functional leaders and research scientists to understand questions like:

  • What are the biggest hurdles in finding and using data in easy and meaningful ways to explore a scientific question?

  • What are the challenges with the data itself? What do you need to make it most usable for analysis and decision-making?

  • How do we leverage our existing data better? What would it take to break down existing data silos and enable broad, trusted use of our data assets?

  • What types of data relationships would be most valuable, and how would you want to consume the data?

  • What is the low-hanging fruit for impacting R&D productivity NOW through democratized data and knowledge?

  • Who would benefit most, and how would we measure the success in terms of efficiency and effectiveness?

  • How would the organization need to shift and change to embrace a new way of doing research driven by data and knowledge?

  • What would we need to show leadership to drive alignment and gain buy-in for future growth and sustained investment in this initiative?

The interviews surfaced incredible insights and complex tensions for the team to address as we considered the path forward. To create a platform of this scale and potential impact would require significant thought and building trust with scientists from the beginning.

The big question: Where do we start?

The journey

Co-creating the path forward

Taking on a vision this big meant we needed to start small. We leveraged our product innovation approach based on design thinking principles, lean startup and agile development methodologies to start bringing the vision to life, step by step.

1

Lead with need

With 14,000 scientists and endless potential uses of the data, we needed to start with a clear use case and set of target users who could help us co-design and develop the solution.

2

Define the real user

In an R&D organization, you have two distinct user types: data generators and data consumers. We needed to consider both user groups and how their unique needs would shape the solutions we built.

3

Prototype and pressure test

We partnered closely with our executive sponsor, a Ph.D. scientist with deep expertise in the subject area, to define and iterate on early prototypes of a highly intuitive user experience for navigating data and relationships—then pressure tested it with research scientists to refine and iterate.

4

Organize the team

To go from prototype to a production-ready platform, we needed to centralize various workstreams into a coherent core team to manage all the aspects of the platform, including the data pipelines, infrastructure, back-end integrations and front-end experience. We built a new team operating model and established ways of working successfully together—all during a pandemic!

5

Co-create and launch

To build and launch the platform, we partnered closely with developers, data scientists, data experts and operational leads to rapidly architect and stand up a platform that could ingest and harmonize internal and external datasets into a sophisticated knowledge graph and searchable tool for exploration.

6

Drive a culture shift

Taking a data-driven approach is a mindset shift, but one that many of the scientists were eager and ready to embrace. Our job was to engage them in an experience that was faster and better than what they have today—and provide the human support and expert context to build trust and confidence in making this transformational shift.

There are two types of users: analysts who care about speed, sharing code, and data. Then receivers consume the analysis. They want to see the outcomes. You need both to be successful.

Director, Analytics

The solution

An integrated data & knowledge platform to empower scientific decision making

In March 2021, we launched a first-of-its-kind data and knowledge platform to an initial group of 100 researchers. The response by leadership and scientists was so positive that we expanded to the full R&D scientific community three months later and have been continuing to evolve and iterate on the platform as we gather feedback and identify new use cases.

Early milestones and signals of success have been remarkable.

As we partner on this multi-year, multi-million dollar initiative, we will continue to work with the team to create deeper value and meaningful impact through data and digital innovation to drive R&D productivity—with the ultimate goal to get life-changing medicines in the hands of patients who need them faster.

Interested in learning how to leverage product innovation to drive your vision? Get in touch.

100+

Over 100 datasets have been harmonized and converged for scientific use, including clinical trial data.

1B+

Over 1 billion data points and relationships exist via the knowledge graph and are searchable in the platform

30+

Over 30 real-world data dashboards have been built to help reduce the time, cost and scope of new studies

2,100+

Over 2,100 R&D scientists are actively using the platform to enable scientific exploration and decision-making

~50

A group of ~50 data scientist super users are leveraging an advanced machine learning environment for deep analysis and predictive modeling

We have recently started using this tool on every program and in-licensing opportunity. Data collection that would have taken hours or days can now be done in minutes, and we have access to more connected data than ever before.

Senior Research Fellow
Let’s start a conversation

Let's shape your insights into experience-led data products together.